

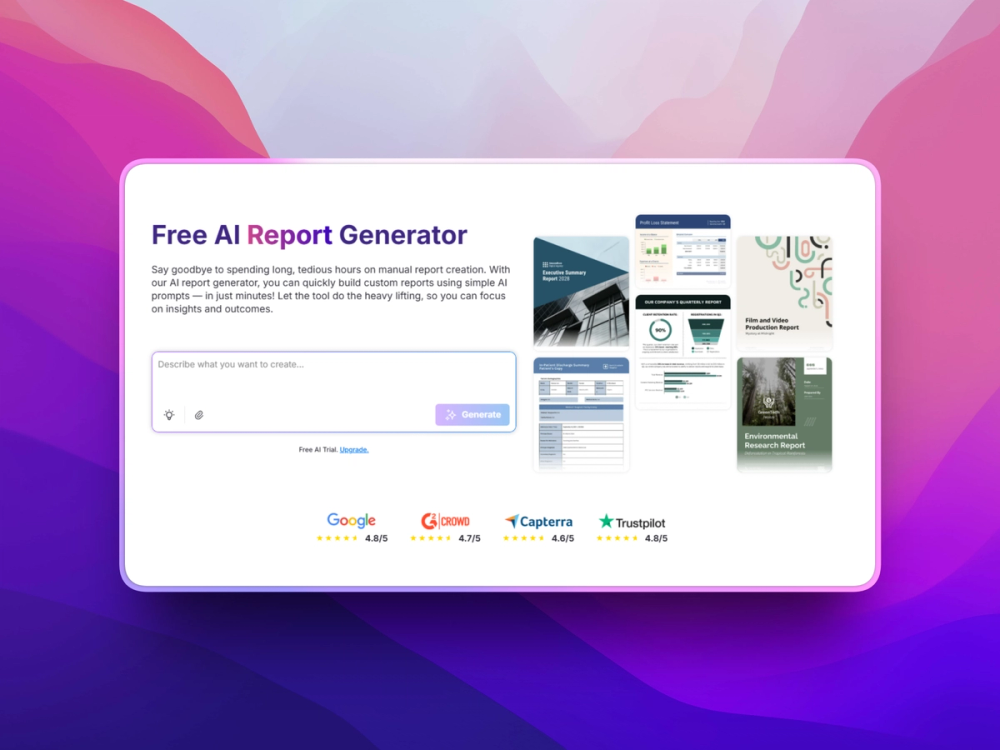
Venngage's AI Report Generator helps teams turn raw information and reporting requirements into professional, presentation-ready reports with minimal design work. Users can describe what they need, generate a complete report structure, customize the content and visuals, apply their brand identity, and share the final result without starting from a blank page.
Key Features
-
AI Report Creation: Generate complete report drafts from a short description of the topic, audience, goals, and information to include.
-
Smart Content Structure: Organize information into logical sections, summaries, findings, recommendations, and supporting visuals.
-
Professional Templates: Use polished report layouts designed for business updates, research, marketing, performance tracking, and client communication.
-
Brand Customization: Keep reports aligned with your organization's visual identity using logos, colors, fonts, and brand guidelines.
-
AI Content Refinement: Improve wording, simplify complex sections, summarize information, and create clearer executive-level content.
-
Charts & Infographics: Convert statistics, trends, and key metrics into visually engaging charts and graphics.
-
Visual Editor: Make final adjustments to pages, text, images, charts, and layouts using an intuitive drag-and-drop interface.
-
Easy Sharing: Export completed reports as PDFs or share them online for convenient stakeholder access and feedback.
Benefits
-
Turn Data Into a Story: Present important business information in a structured format that makes insights easier to understand.
-
Reduce Formatting Work: Spend less time arranging pages, adjusting layouts, and creating visuals manually.
-
Build Better Client Deliverables: Produce polished reports that look professional and are ready to share with customers and stakeholders.
-
Make Recurring Reports Faster: Reuse established structures and branding for regular business, marketing, and performance reporting.
-
Help Non-Designers Create Professionally: Give analysts, marketers, managers, and founders the tools to create strong visual reports independently.
-
Keep Information Engaging: Combine written insights, data visualizations, and graphics to make lengthy reports easier to read.


